To track a private equity fund you keep four running totals: what you committed, what the manager has called, what the fund has paid back to you, and what the manager says your remaining interest is worth on the latest statement. DPI and TVPI are two of those totals divided by the money you have paid in, and the IRR is worked out from the same dated cash flows. This page explains each figure for someone holding a fund personally, with a worked statement.
Commitment, called and uncalled capital
When you invest in a private equity fund you do not hand over the whole amount on day one. You commit to a sum, and the manager draws on it with capital calls, as and when it needs money for investments, fees and costs. Calls can come months or years apart and in irregular sizes.
- Commitment is the total you have agreed to provide.
- Called (also drawn down or contributed) is the part of the commitment the manager has asked for so far.
- Uncalled (also unfunded, undrawn or remaining commitment) is the commitment less what has been called. It is money you can still be asked for, so it is a promise you have made rather than something you own.
Uncalled capital can also go up. Some fund agreements let the manager call back part of a distribution, a recallable distribution, which adds to the uncalled balance again. The sample capital account statement in the reporting standards of ILPA, the institutional investors' association, reconciles it that way: the opening unfunded commitment, less contributions, plus recallable distributions.
Paid in, distributed and NAV
- Paid in is the cash you have actually put in. It usually equals what has been called. It is more when you paid fees on top of a call, and different again if you bought your interest from another investor.
- Distributed is the cash the fund has paid back to you, usually as investments are sold.
- NAV, net asset value, is the manager's valuation of your share of what the fund still holds, as at the date of a capital account statement. It is an estimate until those holdings are sold.
How to calculate DPI and TVPI
- DPI, distributions to paid-in, is distributed divided by paid in. It is cash back per pound put in. It starts at zero; at 1.0x you have had your money back.
- RVPI, residual value to paid-in, is NAV divided by paid in: the part of the value still held.
- TVPI, total value to paid-in, is distributed plus NAV, divided by paid in. It equals DPI plus RVPI.
DPI and TVPI are not the same thing. DPI counts only cash received. TVPI also counts the manager's valuation of what is left, so it moves whenever that valuation does. The BVCA notes that many investors rely on TVPI earlier in a fund's life and on DPI towards the end. It also notes that the industry convention is to show both net, though a manager's headline figure may be gross; check which basis a statement uses before comparing two figures.
A worked statement
A made-up fund. You commit £100,000. The manager calls £20,000 on 1 March 2023, £25,000 on 1 March 2024 and £15,000 on 1 March 2025, with no fees on top, so called and paid in are both £60,000. On 1 March 2026 the fund distributes £12,000. The capital account statement at 30 June 2026 values your interest at £66,000.
- Called: 60% of the commitment. Uncalled: £100,000 − £60,000 = £40,000.
- DPI: £12,000 ÷ £60,000 = 0.20x.
- RVPI: £66,000 ÷ £60,000 = 1.10x.
- TVPI: (£12,000 + £66,000) ÷ £60,000 = 1.30x, which is 0.20x + 1.10x.
- IRR: about 11.6% a year, from the three calls, the distribution and the NAV treated as if received on 30 June 2026.
On 15 September 2026 the manager calls another £10,000. The next statement is months away. Valued as the last NAV plus the new call, your interest is £76,000, paid in is £70,000 and uncalled is £30,000. TVPI becomes (£12,000 + £76,000) ÷ £70,000 = 1.26x, and DPI 0.17x. Nothing about the fund's investments has changed: the multiples fell because new money went in at 1.0x.
Why the figures move between statements
Statements usually come quarterly, and arrive weeks after the date they report on: ILPA's reporting standards expect a quarterly report within 60 days of the quarter end. Calls and distributions happen in between. So any figure worked out on a day between statements mixes an old valuation with newer cash. A call pulls TVPI towards 1.0x, as in the example. A distribution moves value from NAV into DPI, and on its own leaves TVPI where it was. The IRR moves for another reason too: it depends on when each flow happened, so the same NAV gives a different IRR on a later date.
For the same reason, two funds with the same TVPI can have very different IRRs. Multiples ignore how long the money was tied up; the IRR does not. The BVCA's guide on performance measurement shows three funds with identical multiples and IRRs from 11.4% to 26.4%.
Why a young fund looks poor: the J-curve
In its first years a fund typically pays its management fee and set-up costs out of the early calls, and those payments buy no investment of equal value. ILPA's glossary describes this as the reason a fund initially shows a negative return. Plotted over time, the return dips and then rises as investments are sold: the J-curve. The BVCA notes that multiples can be highly variable while capital is still being called, and are most relevant as a fund matures. A TVPI below 1.0x in year two says little about where a fund will end up.
Comparing a fund with others of its vintage
Private equity funds are usually compared with others of the same vintage year: ILPA's glossary describes benchmarking a fund against a sample of funds formed in the same vintage year with the same investment focus. The private equity fund returns tool shows TVPI and DPI by vintage year and strategy, as published by the public pension plans that invest in the funds.
How Fairworth shows it
You record a fund's commitment, then each capital call (with any fees on top), each distribution and each NAV from a statement, from the fund's page or the Add transaction menu. The AI PDF reader can read a capital call notice, a distribution notice or a capital account statement and propose the entries; no entry is saved until you review and submit them.
The fund's page shows Commitment, Called, Called %, Uncalled, Distributed, NAV, DPI, TVPI and IRR, plus Paid in when it differs from Called. DPI and TVPI divide by what you paid in, fees included, and the IRR is worked out from your dated calls and distributions, with the NAV as the final value. Between statements the NAV is the last reported one plus calls, less distributions since. The NAV, DPI, TVPI and IRR tooltips give the last statement's date and, where it differs, the figure at that date. A fund with no statement yet is shown at cost. The same page compares the fund's cash flows with an index you choose, using the KS-PME and direct alpha measures. Private funds sit next to your listed investments, property and cash in your net worth.
The page also draws the fund's whole life on one chart, Cashflows & J-Curve: the money called, shown below zero; the money distributed; the net of the two; each NAV, solid where it came from a statement and hollow where it was adjusted for a call or a distribution; and, at each NAV's date, the total value: NAV plus distributions, less calls, counting only the flows up to that date. For a young fund that total value can sit below zero, which is the dip of the J-curve.
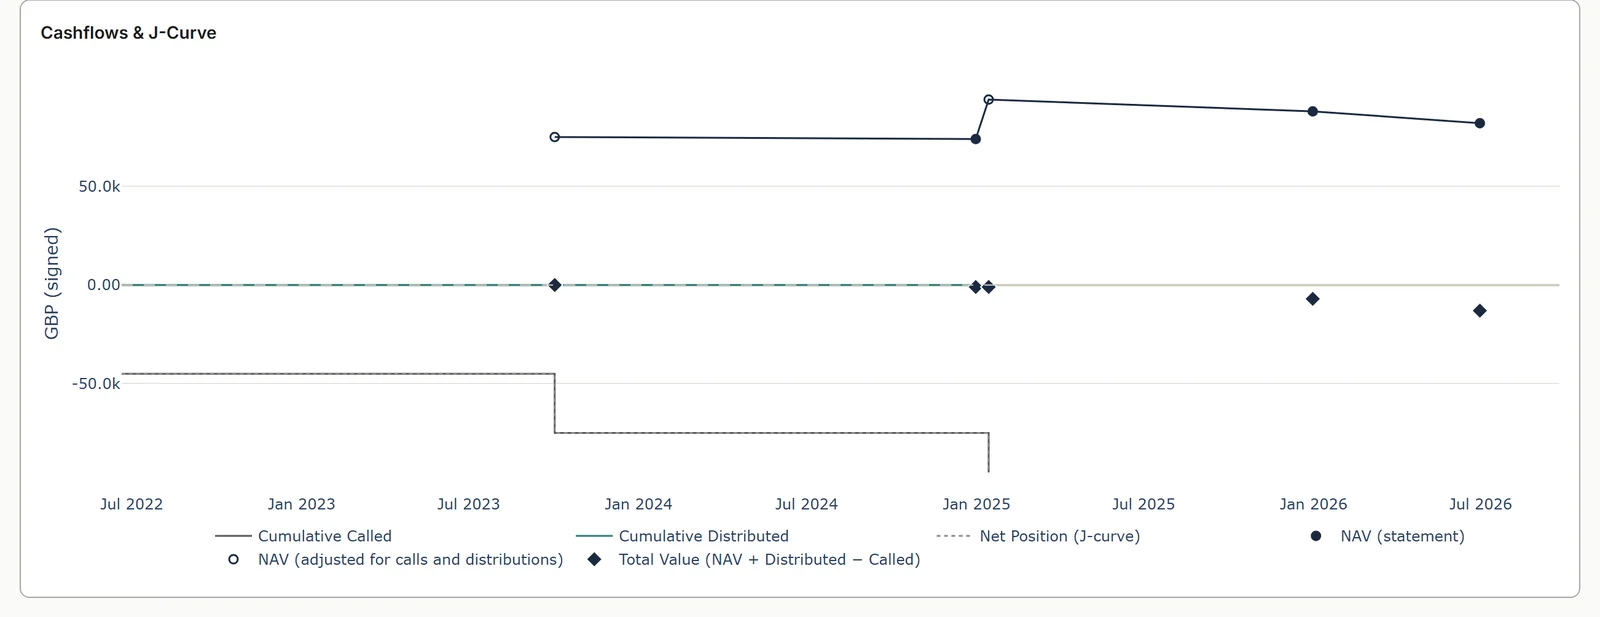
Swipe the screenshot sideways to read it
More on Private markets
- How to value unquoted and crowdfunded shares you own How-toCost, the last funding round, a platform's figure or a write-down: what each value means and how to date it.
Further reading
- Private Equity Performance Measurement (BVCA Perspectives Series, 2015)
- J-curve effect, and benchmarking (ILPA glossary)
- Quarterly Reporting Standards, version 1.1 (ILPA, 2016)
The example uses an invented fund and round figures, and is not the result of any real fund. Figures on a real statement depend on the fund's own agreement and accounting. This page is information, not investment advice.